前言
sar是System Activity Reporter(系统活动情况报告)的缩写。sar工具将对系统当前的状态进行取样,然后通过计算数据和比例来表达系统的当前运行状态。它的特点是可以连续对系统取样,获得大量的取样数据;取样数据和分析的结果都可以存入文件,所需的负载很小。sar是目前Linux上最为全面的系统性能分析工具之一,可以从14个大方面对系统的活动进行报告,包括文件的读写情况、系统调用的使用情况、串口、CPU效率、内存、网络、磁盘使用状况、进程活动及IPC有关的活动等,使用也是较为复杂。 yum install sysstat #由sysstat提供。SYSSTAT是一组软件包,包含监测系统性能及效率的一组工具,这些工具对于我们收集系统性能数据,比如CPU使用率、硬盘和网络吞吐数据,这些数据的收集和分析,有利于我们判断系统是否正常运行,是提高系统运行效率、安全运行服务器的得力助手。更多见github sysstat sar是查看操作系统报告指标的各种工具中,最为普遍和方便的;它有两种用法;
- 追溯过去的统计数据(默认)
- 周期性的查看当前数据
- 日志记录在/var/log/sa/目录中的按日文件,文件为2进制,下面有打开命令示例,不指定-f参数时,打开当天的日志。
包依赖
x1Dependencies Resolved2===========================================================================================================================3``Package Arch Version Repository Size4===========================================================================================================================5Installing:6``sysstat x86_64 10.1.5-18.el7_7.1 updates 315 k7Installing for dependencies:8``lm_sensors-libs x86_64 3.4.0-8.20160601gitf9185e5.el7 base
使用操作
1[root@centos77 ~]# ls -alh /var/log/sa/2total 3.4M3drwxr-xr-x. 2 root root 93 Mar 29 00:00 .4drwxr-xr-x. 9 root root 4.0K Mar 29 03:18 ..5-rw-r--r--. 1 root root 531K Mar 26 23:50 sa266-rw-r--r-- 1 root root 574K Mar 27 23:50 sa277-rw-r--r-- 1 root root 574K Mar 28 23:50 sa288-rw-r--r-- 1 root root 323K Mar 29 13:20 sa299-rw-r--r-- 1 root root 435K Mar 26 23:53 sar2610-rw-r--r-- 1 root root 436K Mar 27 23:53 sar2711-rw-r--r-- 1 root root 436K Mar 28 23:53 sar28
| 列 | 说明 |
|---|---|
| %user | 用户模式下消耗的CPU时间的比例 |
| %nice | 通过nice改变了进程调度优先级的进程,在用户模式下消耗的CPU时间的比例 |
| %system | 系统模式下消耗的CPU时间的比例 |
| %iowait | CPU等待磁盘I/O而导致空闲状态消耗时间的比例 |
| %steal | 利用Xen等操作系统虚拟化技术时,等待其他虚拟CPU计算占用的时间比例 |
| %idle | CPU没有等待磁盘I/O等的空闲状态消耗的时间比例 |
注:
- 如果 %iowait 的值过高,表示硬盘存在I/O瓶颈
- 如果 %idle 的值高但系统响应慢时,有可能是 CPU 等待分配内存,此时应加大内存容量
- 如果 %idle 的值持续低于 10,则系统的 CPU 处理能力相对较低,表明系统中最需要解决的资源是 CPU
cpu负载统计
1[root@centos76 ~]# sar -u2Linux 3.10.0-1062.el7.x86_64 (centos77) 03/29/2020 _x86_64_ (8 CPU)3# 每间隔10分钟412:00:01 AM CPU %user %nice %system %iowait %steal %idle512:10:01 AM all 0.20 0.00 0.22 0.00 0.00 99.57612:20:01 AM all 0.19 0.00 0.21 0.00 0.00 99.59712:30:01 AM all 0.19 0.00 0.23 0.00 0.00 99.58812:40:01 AM all 0.19 0.00 0.22 0.00 0.00 99.59912:50:01 AM all 0.19 0.00 0.22 0.00 0.00 99.581001:00:01 AM all 0.20 0.00 0.23 0.00 0.00 99.571101:10:01 AM all 0.19 0.00 0.22 0.01 0.00 99.581201:20:01 AM all 0.19 0.00 0.22 0.00 0.00 99.591301:30:01 AM all 0.19 0.00 0.22 0.00 0.00 99.591401:40:01 AM all 0.20 0.00 0.22 0.01 0.00 99.57
xxxxxxxxxx1351[root@centos77 ~]# sar -f /var/log/sa/sa29 #显示 cpu 统计2Linux 3.10.0-1062.el7.x86_64 (centos77) 03/29/2020 _x86_64_ (8 CPU)3 412:00:01 AM CPU %user %nice %system %iowait %steal %idle512:10:01 AM all 0.20 0.00 0.22 0.00 0.00 99.57612:20:01 AM all 0.19 0.00 0.21 0.00 0.00 99.59712:30:01 AM all 0.19 0.00 0.23 0.00 0.00 99.58812:40:01 AM all 0.19 0.00 0.22 0.00 0.00 99.59912:50:01 AM all 0.19 0.00 0.22 0.00 0.00 99.581001:00:01 AM all 0.20 0.00 0.23 0.00 0.00 99.571101:10:01 AM all 0.19 0.00 0.22 0.01 0.00 99.581201:20:01 AM all 0.19 0.00 0.22 0.00 0.00 99.5913[root@centos77 ~]# sar -P 2 5 # 单核cpu2,间隔5秒14Linux 3.10.0-1062.el7.x86_64 (centos77) 03/29/2020 _x86_64_ (8 CPU)15 1612:58:45 PM CPU %user %nice %system %iowait %steal %idle1712:58:50 PM 2 0.20 0.00 0.40 0.00 0.00 99.401812:58:55 PM 2 0.40 0.00 0.40 0.00 0.00 99.201912:59:00 PM 2 0.20 0.00 0.20 0.00 0.00 99.602012:59:05 PM 2 0.40 0.00 0.60 0.00 0.00 99.002112:59:10 PM 2 0.20 0.00 0.40 0.00 0.00 99.4022^C23 2412:59:11 PM 2 0.55 0.00 0.55 0.00 0.00 98.9025Average: 2 0.30 0.00 0.41 0.00 0.00 99.2926[root@centos77 ~]# sar -P 2 1 5 # 单核cpu2 间隔1秒,显示5行。27Linux 3.10.0-1062.el7.x86_64 (centos77) 03/29/2020 _x86_64_ (8 CPU)28 2912:59:15 PM CPU %user %nice %system %iowait %steal %idle3012:59:16 PM 2 0.00 0.00 1.00 0.00 0.00 99.003112:59:17 PM 2 0.00 0.00 0.00 0.00 0.00 100.003212:59:18 PM 2 0.99 0.00 0.99 0.00 0.00 98.0233^C3412:59:19 PM 2 0.00 0.00 0.00 0.00 0.00 100.0035Average: 2 0.25 0.00 0.51 0.00 0.00 99.24
内存使用统计
xxxxxxxxxx1131[root@centos77 ~]# sar -f /var/log/sa/sa29 -r # 显示内存情况2Linux 3.10.0-1062.el7.x86_64 (centos77) 03/29/2020 _x86_64_ (8 CPU)3 412:00:01 AM kbmemfree kbmemused %memused kbbuffers kbcached kbcommit %commit kbactive kbinact kbdirty512:10:01 AM 195488 7959504 97.60 88 3279956 11000788 107.30 4242852 3284524 112612:20:01 AM 194384 7960608 97.62 88 3280932 11000828 107.30 4245252 3284116 108712:30:01 AM 192812 7962180 97.64 88 3281852 11000856 107.30 4246812 3284140 148812:40:01 AM 192240 7962752 97.64 88 3282776 11000812 107.30 4248080 3284172 96912:50:01 AM 187580 7967412 97.70 88 3283680 11005596 107.35 4252428 3284208 1001001:00:01 AM 178304 7976688 97.81 88 3284644 11025288 107.54 4257008 3284280 1481101:10:01 AM 197028 7957964 97.58 88 3277748 10999856 107.29 4235324 3291388 921201:20:01 AM 195228 7959764 97.61 88 3278620 10999892 107.29 4237872 3291408 1161301:30:01 AM 194364 7960628 97.62 88 3279532 10998236 107.28 4238272 3290924 108当天
xxxxxxxxxx1261[root@centos77 ~]# sar -C -r207:20:01 AM kbmemfree kbmemused %memused kbbuffers kbcached kbcommit %commit kbactive kbinact kbdirty307:30:01 AM 264872 7890120 96.75 88 3195060 10992792 107.22 4197820 3262464 116407:40:01 AM 263960 7891032 96.76 88 3195984 10992800 107.22 4198964 3262496 124507:50:01 AM 258444 7896548 96.83 88 3196920 10997496 107.27 4203168 3262532 112608:00:01 AM 250852 7904140 96.92 88 3197864 11017004 107.46 4208392 3262572 1447..812:10:01 PM 225168 7929824 97.24 88 3222560 10993756 107.23 4234252 3264212 108912:20:01 PM 222852 7932140 97.27 88 3223596 10993728 107.23 4235876 3264280 1201012:30:02 PM 222732 7932260 97.27 88 3224556 10993764 107.23 4237528 3263764 1001112:40:01 PM 219664 7935328 97.31 88 3225500 10993756 107.23 4240088 3263056 12012Average: 234585 7920407 97.12 88 3224526 11004016 107.33 4217003 3272228 11513[root@centos76 ~]# free -hw14 total used free shared buffers cache available15Mem: 7.8G 4.3G 211M 24M 88K 3.2G 3.1G16Swap: 2.0G 581M 1.4G17[root@centos77 ~]# sar -C -r 1 518Linux 3.10.0-1062.el7.x86_64 (centos77) 03/29/2020 _x86_64_ (8 CPU)19 2012:56:39 PM kbmemfree kbmemused %memused kbbuffers kbcached kbcommit %commit kbactive kbinact kbdirty2112:56:40 PM 215864 7939128 97.35 88 3227076 10996984 107.27 4245524 3262840 1282212:56:41 PM 215864 7939128 97.35 88 3227076 10996984 107.27 4245524 3262840 1282312:56:42 PM 215848 7939144 97.35 88 3227084 10996984 107.27 4245536 3262840 1402412:56:43 PM 215848 7939144 97.35 88 3227084 10996984 107.27 4245536 3262840 1402512:56:44 PM 215864 7939128 97.35 88 3227088 10996984 107.27 4245536 3262844 14426Average: 215858 7939134 97.35 88 3227082 10996984 107.27 4245531 3262841 136| 列 | 说明 |
|---|---|
| kbmemfree | 空闲物理内存量 |
| kbmemused | 使用中的物理内存量 |
| %memused | 物理内存量使用率 |
| kbbuffers | 内核中作为缓冲区使用的物理内存容量 |
| kbcacheed | 内核中作为缓存使用的物理内存容量 |
| kbswpfree | 交换区的空闲容量 |
| kbswpused | 使用中的交换区容量 |
swap使用统计
xxxxxxxxxx1151[root@centos77 ~]# sar -f /var/log/sa/sa29 -W2Linux 3.10.0-1062.el7.x86_64 (centos77) 03/29/2020 _x86_64_ (8 CPU)3 412:00:01 AM pswpin/s pswpout/s512:10:01 AM 0.00 0.00612:20:01 AM 0.01 0.00712:30:01 AM 0.01 0.00812:40:01 AM 0.00 0.00912:50:01 AM 0.00 0.001001:00:01 AM 0.01 0.001101:10:01 AM 0.00 0.001201:20:01 AM 0.00 0.001301:30:01 AM 0.00 0.0014...15Average: 0.00 0.00网络带宽
xxxxxxxxxx1111#sar -f /var/log/sa/sa29 -r -n DEV212:00:01 PM IFACE rxpck/s txpck/s rxkB/s txkB/s rxcmp/s txcmp/s rxmcst/s312:10:01 PM ens34 0.64 0.10 0.05 0.01 0.00 0.00 0.00412:10:01 PM lo 45.03 45.03 8.01 8.01 0.00 0.00 0.00512:10:01 PM ens33 3.01 2.36 0.22 0.21 0.00 0.00 0.006...712:40:01 PM docker0 0.00 0.00 0.00 0.00 0.00 0.00 0.008Average: ens34 0.53 0.10 0.04 0.01 0.00 0.00 0.009Average: lo 44.37 44.37 7.81 7.81 0.00 0.00 0.0010Average: ens33 2.86 2.30 0.22 0.21 0.00 0.00 0.0011Average: docker0 0.00 0.00 0.00 0.00 0.00 0.00 0.00
缓存
xxxxxxxxxx1211[root@centos77 ~]# sar -b 2Linux 3.10.0-1062.el7.x86_64 (centos77) 03/29/2020 _x86_64_ (8 CPU)3 412:00:01 AM tps rtps wtps bread/s bwrtn/s512:10:01 AM 1.04 0.00 1.04 0.00 17.76612:20:01 AM 0.89 0.01 0.89 0.31 15.047 807:20:01 AM tps rtps wtps bread/s bwrtn/s9...1012:50:01 PM 0.92 0.00 0.92 0.07 19.9111Average: 0.92 0.00 0.92 0.29 15.4512[root@centos77 ~]# sar -b 1 5 # 实时显示5行,间隔1秒13Linux 3.10.0-1062.el7.x86_64 (centos76) 03/29/2020 _x86_64_ (8 CPU)14 1512:55:23 PM tps rtps wtps bread/s bwrtn/s1612:55:24 PM 0.00 0.00 0.00 0.00 0.001712:55:25 PM 0.00 0.00 0.00 0.00 0.001812:55:26 PM 0.00 0.00 0.00 0.00 0.001912:55:27 PM 0.00 0.00 0.00 0.00 0.002012:55:28 PM 0.00 0.00 0.00 0.00 0.0021Average: 0.00 0.00 0.00 0.00 0.00
副录
sar帮助示例简版
xxxxxxxxxx1131EXAMPLES2 sar -u 2 53 Report CPU utilization for each 2 seconds. 5 lines are displayed.4 5 sar -I 14 -o int14.file 2 106 Report statistics on IRQ 14 for each 2 seconds. 10 lines are displayed. Data are stored in a file called7 int14.file.8 9 sar -r -n DEV -f /var/log/sa/sa1610 Display memory and network statistics saved in daily data file 'sa16'.11 12 sar -A13 Display all the statistics saved in current daily data file.
sysstat服务
xxxxxxxxxx1161[root@centos76 ~]# systemctl status sysstat2● sysstat.service - Resets System Activity Logs3 Loaded: loaded (/usr/lib/systemd/system/sysstat.service; enabled; vendor preset: enabled)4 Active: active (exited) since Thu 2020-03-26 20:14:57 CST; 2 days ago5 Main PID: 1000 (code=exited, status=0/SUCCESS)6 Tasks: 07 Memory: 0B8 CGroup: /system.slice/sysstat.service9 10Mar 26 20:14:57 centos76 systemd[1]: Starting Resets System Activity Logs...11Mar 26 20:14:57 centos76 systemd[1]: Started Resets System Activity Logs.12You have new mail in /var/mail/root13[root@centos76 ~]# journalctl -u sysstat14-- Logs begin at Thu 2020-03-26 20:14:49 CST, end at Sun 2020-03-29 12:50:18 CST. --15Mar 26 20:14:57 centos76 systemd[1]: Starting Resets System Activity Logs...16Mar 26 20:14:57 centos76 systemd[1]: Started Resets System Activity Logs.
sysstat工作包内其它工具
- iostat 工具提供CPU使用率及硬盘吞吐效率的数据; #比较核心的工具
- mpstat 工具提供单个处理器或多个处理器相关数据;
- pidstat: 关于运行中的进程/任务、CPU、内存等的统计信息
- sar 工具负责收集、报告并存储系统活跃的信息; #统计数据的核心工具
- sa1 工具负责收集并存储每天系统动态信息到一个二进制的文件中。它是通过计划任务工具cron来运行,是为sadc所设计的程序前端程序;
- sa2工具负责把每天的系统活跃性息写入总结性的报告中。它是为sar所设计的前端 ,要通过cron来调用
- sadc 是系统动态数据收集工具,收集的数据被写一个二进制的文件中,它被用作sar工具的后端;
- sadf 显示被sar通过多种格式收集的数据;
- nfsiostat: NFS(Network File System)的I/O统计信息。
- cifsiostat: CIFS(Common Internet File System)的统计信息
xxxxxxxxxx1681[root@centos76 ~]# rpm -ql sysstat2/etc/cron.d/sysstat3/etc/sysconfig/sysstat4/etc/sysconfig/sysstat.ioconf5/usr/bin/cifsiostat6/usr/bin/iostat7/usr/bin/mpstat8/usr/bin/nfsiostat-sysstat9/usr/bin/pidstat10/usr/bin/sadf11/usr/bin/sar12/usr/bin/tapestat13/usr/lib/systemd/system/sysstat.service14/usr/lib64/sa15/usr/lib64/sa/sa116/usr/lib64/sa/sa217/usr/lib64/sa/sadc18/usr/share/doc/sysstat-10.1.519/usr/share/doc/sysstat-10.1.5/CHANGES20/usr/share/doc/sysstat-10.1.5/COPYING21/usr/share/doc/sysstat-10.1.5/CREDITS22/usr/share/doc/sysstat-10.1.5/FAQ23/usr/share/doc/sysstat-10.1.5/README24/usr/share/doc/sysstat-10.1.5/sysstat-10.1.5.lsm25/usr/share/locale/af/LC_MESSAGES/sysstat.mo26/usr/share/locale/cs/LC_MESSAGES/sysstat.mo27/usr/share/locale/da/LC_MESSAGES/sysstat.mo28/usr/share/locale/de/LC_MESSAGES/sysstat.mo29/usr/share/locale/eo/LC_MESSAGES/sysstat.mo30/usr/share/locale/es/LC_MESSAGES/sysstat.mo31/usr/share/locale/eu/LC_MESSAGES/sysstat.mo32/usr/share/locale/fi/LC_MESSAGES/sysstat.mo33/usr/share/locale/fr/LC_MESSAGES/sysstat.mo34/usr/share/locale/hr/LC_MESSAGES/sysstat.mo35/usr/share/locale/id/LC_MESSAGES/sysstat.mo36/usr/share/locale/it/LC_MESSAGES/sysstat.mo37/usr/share/locale/ja/LC_MESSAGES/sysstat.mo38/usr/share/locale/ky/LC_MESSAGES/sysstat.mo39/usr/share/locale/lv/LC_MESSAGES/sysstat.mo40/usr/share/locale/mt/LC_MESSAGES/sysstat.mo41/usr/share/locale/nb/LC_MESSAGES/sysstat.mo42/usr/share/locale/nl/LC_MESSAGES/sysstat.mo43/usr/share/locale/nn/LC_MESSAGES/sysstat.mo44/usr/share/locale/pl/LC_MESSAGES/sysstat.mo45/usr/share/locale/pt/LC_MESSAGES/sysstat.mo46/usr/share/locale/pt_BR/LC_MESSAGES/sysstat.mo47/usr/share/locale/ro/LC_MESSAGES/sysstat.mo48/usr/share/locale/ru/LC_MESSAGES/sysstat.mo49/usr/share/locale/sk/LC_MESSAGES/sysstat.mo50/usr/share/locale/sr/LC_MESSAGES/sysstat.mo51/usr/share/locale/sv/LC_MESSAGES/sysstat.mo52/usr/share/locale/uk/LC_MESSAGES/sysstat.mo53/usr/share/locale/vi/LC_MESSAGES/sysstat.mo54/usr/share/locale/zh_CN/LC_MESSAGES/sysstat.mo55/usr/share/locale/zh_TW/LC_MESSAGES/sysstat.mo56/usr/share/man/man1/cifsiostat.1.gz57/usr/share/man/man1/iostat.1.gz58/usr/share/man/man1/mpstat.1.gz59/usr/share/man/man1/nfsiostat-sysstat.1.gz60/usr/share/man/man1/pidstat.1.gz61/usr/share/man/man1/sadf.1.gz62/usr/share/man/man1/sar.1.gz63/usr/share/man/man1/tapestat.1.gz64/usr/share/man/man5/sysstat.5.gz65/usr/share/man/man8/sa1.8.gz66/usr/share/man/man8/sa2.8.gz67/usr/share/man/man8/sadc.8.gz68/var/log/sa
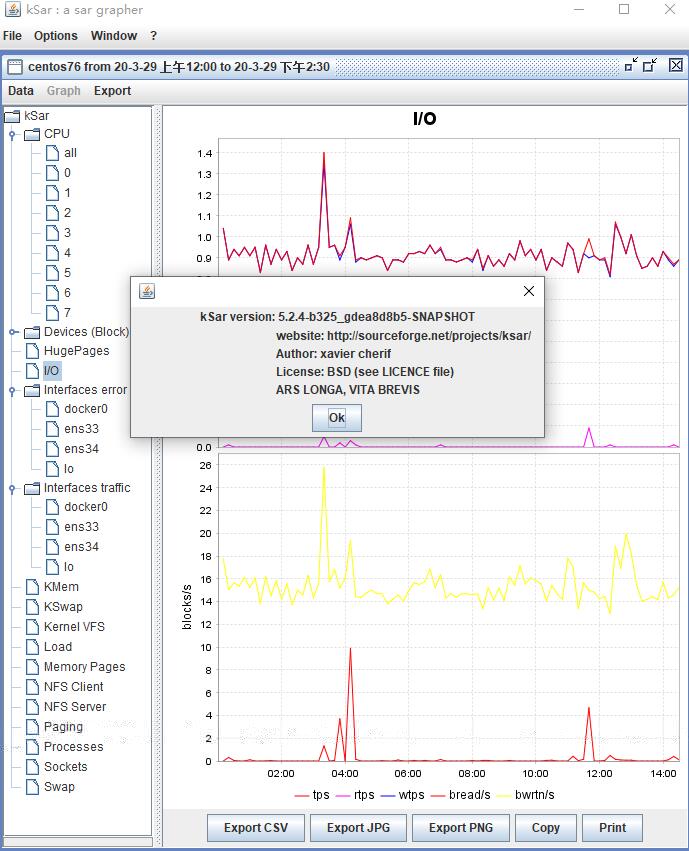
ksar使用
kSar为jar程序,需要要java8以上版本
打开jar主程序
- java.exe -jar ksar-5.2.4-b325_gdea8d8b5-SNAPSHOT-all.jar
数据准备:将sar当前或某天的元数据进行文本化输出,ksar只识别纯文本。不认二进制源文件,可以支持多个文本文件追加显统计。可以导出生成图形为图片。
- 在kSar程序中选择Data,导入(load)或追加(Append)以上转换的纯文本文件。支持多窗口(File-->new windows)。
xxxxxxxxxx31java.exe -jar ksar-5.2.4-b325_gdea8d8b5-SNAPSHOT-all.jar2sar -A > /tmp/sar.data.txt3sar -f /var/log/sa/sa29 -A > /tmp/sa29.txt
kSar自动加载服务器sa日志
截止目前版本kSar支持直接连接服务器获取sa日志,不用再手动 Data—> 选择ssh连接到相应的服务器直接读取(当然不是读取二进制的源文件,而是如图用sar -A 进行输出,不用我们再手动执行命令转换后导入生成数据了。
- 用途1:直接将第3方服务器上的sa日志,放在测试服务器上的/var/log/sa目录下,即可用此ssh方式自动生成图表,尤其适用于日志天数比较多的场景。
sar manual 完整版帮助手册
xxxxxxxxxx12091SAR(1) Linux User's Manual SAR(1)2 3 4 5NAME6 sar - Collect, report, or save system activity information.7 8SYNOPSIS9 sar [ -A ] [ -B ] [ -b ] [ -C ] [ -d ] [ -F ] [ -H ] [ -h ] [ -p ] [ -q ] [ -R ] [ -r ] [ -S ] [ -t ] [ -u [ ALL10 ] ] [ -V ] [ -v ] [ -W ] [ -w ] [ -y ] [ -I { int [,...] | SUM | ALL | XALL } ] [ -P { cpu [,...] | ALL } ] [ -m11 { keyword [,...] | ALL } ] [ -n { keyword [,...] | ALL } ] [ -j { ID | LABEL | PATH | UUID | ... } ] [ -f [12 filename ] | -o [ filename ] | -[0-9]+ ] [ -i interval ] [ -s [ hh:mm:ss ] ] [ -e [ hh:mm:ss ] ] [ interval [13 count ] ]14 15DESCRIPTION16 The sar command writes to standard output the contents of selected cumulative activity counters in the operating17 system. The accounting system, based on the values in the count and interval parameters, writes information the18 specified number of times spaced at the specified intervals in seconds. If the interval parameter is set to19 zero, the sar command displays the average statistics for the time since the system was started. If the interval20 parameter is specified without the count parameter, then reports are generated continuously. The collected data21 can also be saved in the file specified by the -o filename flag, in addition to being displayed onto the screen.22 If filename is omitted, sar uses the standard system activity daily data file, the /var/log/sa/sadd file, where23 the dd parameter indicates the current day. By default all the data available from the kernel are saved in the24 data file.25 26 The sar command extracts and writes to standard output records previously saved in a file. This file can be27 either the one specified by the -f flag or, by default, the standard system activity daily data file. It is28 also possible to enter -1, -2 etc. as an argument to sar to display data of that days ago. For example, -1 will29 point at the standard system activity file of yesterday.30 31 Without the -P flag, the sar command reports system-wide (global among all processors) statistics, which are32 calculated as averages for values expressed as percentages, and as sums otherwise. If the -P flag is given, the33 sar command reports activity which relates to the specified processor or processors. If -P ALL is given, the sar34 command reports statistics for each individual processor and global statistics among all processors.35 36 You can select information about specific system activities using flags. Not specifying any flags selects only37 CPU activity. Specifying the -A flag selects all possible activities.38 39 The default version of the sar command (CPU utilization report) might be one of the first facilities the user40 runs to begin system activity investigation, because it monitors major system resources. If CPU utilization is41 near 100 percent (user + nice + system), the workload sampled is CPU-bound.42 43 If multiple samples and multiple reports are desired, it is convenient to specify an output file for the sar44 command. Run the sar command as a background process. The syntax for this is:45 46 sar -o datafile interval count >/dev/null 2>&1 &47 48 All data are captured in binary form and saved to a file (datafile). The data can then be selectively displayed49 with the sar command using the -f option. Set the interval and count parameters to select count records at50 interval second intervals. If the count parameter is not set, all the records saved in the file will be51 selected. Collection of data in this manner is useful to characterize system usage over a period of time and52 determine peak usage hours.53 54 Note: The sar command only reports on local activities.55 56 57OPTIONS58 -A This is equivalent to specifying -bBdFHqrRSuvwWy -I SUM -I XALL -m ALL -n ALL -u ALL -P ALL.59 -B Report paging statistics. The following values are displayed:60 -b Report I/O and transfer rate statistics. The following values are displayed:61 -C When reading data from a file, tell sar to display comments that have been inserted by sadc.62 -d Report activity for each block device. When data are displayed, the device specification dev m-n is gen‐63 erally used ( DEV column). m is the major number of the device and n its minor number. Device names may64 also be pretty-printed if option -p is used or persistent device names can be printed if option -j is65 used (see below). Note that disk activity depends on sadc options "-S DISK" and "-S XDISK" to be col‐66 lected. The following values are displayed:67 -e [ hh:mm:ss ]68 Set the ending time of the report. The default ending time is 18:00:00. Hours must be given in 24-hour69 format. This option can be used when data are read from or written to a file (options -f or -o).70 71 -F [ MOUNT ]72 Display statistics for currently mounted filesystems. Pseudo-filesystems are ignored. At the end of the73 report, sar will display a summary of all those filesystems. Note that filesystems statistics depend on74 sadc option -S XDISK to be collected. Use of the MOUNT parameter keyword indicates that mountpoint will75 be reported instead of filesystem device. [行表统计]76 77 -f [ filename ]78 Extract records from filename (created by the -o filename flag). The default value of the filename param‐79 eter is the current daily data file, the /var/log/sa/sadd file. The -f option is exclusive of the -o80 option.81 82 -H Report hugepages utilization statistics. The following values are displayed: [行表统计]83 84 -h Display a short help message then exit.85 86 -I { int [,...] | SUM | ALL | XALL }87 Report statistics for a given interrupt. int is the interrupt number. Specifying multiple -I int parame‐88 ters on the command line will look at multiple independent interrupts. The SUM keyword indicates that89 the total number of interrupts received per second is to be displayed. The ALL keyword indicates that90 statistics from the first 16 interrupts are to be reported, whereas the XALL keyword indicates that sta‐91 tistics from all interrupts, including potential APIC interrupt sources, are to be reported. Note that92 interrupt statistics depend on sadc option "-S INT" to be collected.93 94 -i interval95 Select data records at seconds as close as possible to the number specified by the interval parameter.96 97 -j { ID | LABEL | PATH | UUID | ... }98 Display persistent device names. Use this option in conjunction with option -d. Options ID, LABEL, etc.99 specify the type of the persistent name. These options are not limited, only prerequisite is that direc‐100 tory with required persistent names is present in /dev/disk. If persistent name is not found for the101 device, the device name is pretty-printed (see option -p below).102 103 -m { keyword [,...] | ALL }104 Report power management statistics. Note that these statistics depend on sadc option "-S POWER" to be105 collected.106 107 Possible keywords are CPU, FAN, FREQ, IN, TEMP and USB.108 109 With the CPU keyword, statistics about CPU are reported. The following value is displayed:110 111 [行表统计]112 -n { keyword [,...] | ALL }113 Report network statistics.114 115 Possible keywords are DEV, EDEV, NFS, NFSD, SOCK, IP, EIP, ICMP, EICMP, TCP, ETCP, UDP, SOCK6, IP6, EIP6,116 ICMP6, EICMP6 and UDP6.117 118 With the DEV keyword, statistics from the network devices are reported. The following values are dis‐119 played: [非常细分的行表统计]120 -o [ filename ] #保存到文件121 Save the readings in the file in binary form. Each reading is in a separate record. The default value of122 the filename parameter is the current daily data file, the /var/log/sa/sadd file. The -o option is exclu‐123 sive of the -f option. All the data available from the kernel are saved in the file (in fact, sar calls124 its data collector sadc with the option "-S ALL". See sadc(8) manual page).125 126 -P { cpu [,...] | ALL }127 Report per-processor statistics for the specified processor or processors. Specifying the ALL keyword128 reports statistics for each individual processor, and globally for all processors. Note that processor 0129 is the first processor. [行表统计]130 131 -p Pretty-print device names. Use this option in conjunction with option -d. By default names are printed132 as dev m-n where m and n are the major and minor numbers for the device. Use of this option displays the133 names of the devices as they (should) appear in /dev. Name mappings are controlled by /etc/sysconfig/sys‐134 stat.ioconf. [行表统计]135 136 -q Report queue length and load averages. The following values are displayed: [行表统计]137 -R Report memory statistics. The following values are displayed: [行表统计]138 -r Report memory utilization statistics. The following values are displayed: [行表统计]139 -S Report swap space utilization statistics. The following values are displayed: [行表统计]140 -s [ hh:mm:ss ]141 Set the starting time of the data, causing the sar command to extract records time-tagged at, or follow‐142 ing, the time specified. The default starting time is 08:00:00. Hours must be given in 24-hour format.143 This option can be used only when data are read from a file (option -f ).144 145 -t When reading data from a daily data file, indicate that sar should display the timestamps in the original146 local time of the data file creator. Without this option, the sar command displays the timestamps in the147 user's locale time.148 149 -u [ ALL ]150 Report CPU utilization. The ALL keyword indicates that all the CPU fields should be displayed. The151 report may show the following fields: [行表统计]152 -V Print version number then exit.153 -v Report status of inode, file and other kernel tables. The following values are displayed: [行表统计]154 -W Report swapping statistics. The following values are displayed: [行表统计]155 -w Report task creation and system switching activity. [行表统计]156 -y Report TTY device activity. The following values are displayed: [行表统计]157 158ENVIRONMENT159 The sar command takes into account the following environment variables:160 161 162 S_TIME_FORMAT163 If this variable exists and its value is ISO then the current locale will be ignored when printing the164 date in the report header. The sar command will use the ISO 8601 format (YYYY-MM-DD) instead.165 166 167 S_TIME_DEF_TIME168 If this variable exists and its value is UTC then sar will save its data in UTC time (data will still be169 displayed in local time). sar will also use UTC time instead of local time to determine the current170 daily data file located in the /var/log/sa directory. This variable may be useful for servers with users171 located across several timezones.172 173EXAMPLES174 sar -u 2 5175 Report CPU utilization for each 2 seconds. 5 lines are displayed.176 177 sar -I 14 -o int14.file 2 10178 Report statistics on IRQ 14 for each 2 seconds. 10 lines are displayed. Data are stored in a file called179 int14.file.180 181 sar -r -n DEV -f /var/log/sa/sa16182 Display memory and network statistics saved in daily data file 'sa16'.183 184 sar -A185 Display all the statistics saved in current daily data file.186 187BUGS188 /proc filesystem must be mounted for the sar command to work.189 190 All the statistics are not necessarily available, depending on the kernel version used. sar assumes that you191 are using at least a 2.6 kernel.192 193FILES194 /var/log/sa/sadd195 Indicate the daily data file, where the dd parameter is a number representing the day of the month.196 197 /proc contains various files with system statistics.198 199AUTHOR200 Sebastien Godard (sysstat <at> orange.fr)201 202SEE ALSO203 sadc(8), sa1(8), sa2(8), sadf(1), pidstat(1), mpstat(1), iostat(1), vmstat(8)204 205 http://pagesperso-orange.fr/sebastien.godard/206 207 208 209Linux SEPTEMBER 2012 SAR(1)
引用
http://sebastien.godard.pagesperso-orange.fr/ https://github.com/sysstat/sysstat https://github.com/vlsi/ksar #可视化图形工具,依赖java,但重点推荐新手,只需要将/var/log/sa/下载后,用kSar导入查看,完全图表式的检查,一用便停不下来 https://zhuanlan.zhihu.com/p/34223218 https://www.linuxidc.com/Linux/2019-08/160082.htm